Insurance Client Risk Dashboard
The Problem
Insurance operations teams discover client risk too late. A client who's likely to file a high-cost claim, cancel mid-term, or dispute coverage shows warning signs at intake. But those signals are buried across forms, call notes, and payment preferences that nobody synthesizes until there's already a problem.
Underwriting models handle pricing risk. What they don't handle is operational risk: which clients will consume the most ops resources, which will churn, and which need proactive intervention before they become a retention issue. Ops managers make these calls on gut feel, which means the quality of the decision depends entirely on who's working that day.
What We Built
A client risk scoring dashboard that evaluates every client at intake and assigns a risk score with a full breakdown of contributing factors, so ops teams know who needs attention before problems surface.
The system provides:
- •A risk score (0 to 100) and severity level for every client (Low, High, or Critical), visible in a single list view
- •Contributing factor breakdowns. Not just a number, but the specific signals driving it. For example: "Immediate urgency correlates with higher risk: +15" or "Cash payment preference shows higher cancellation risk: +12" or "Prior insurance experience reduces risk: -12"
- •Actionable context: each factor comes with a direction (raises/lowers risk) and a magnitude, so an ops manager can see exactly what's driving a Critical score and decide on the appropriate intervention
- •A client list view with the full book sorted and scored, so managers can triage their day around the clients that actually need attention
A score of 84 means nothing on its own. A score of 84 driven by "cash payment preference +12, immediate urgency +15, no prior coverage +10" tells the ops team exactly what kind of risk this is and what to do about it.
Outcome
Agents and producers know where to spend their time. The clients flagged Critical tend to consume the most service hours and renew the least; concentrating effort on the rest of the book pays off in both retention and commissions.
See It in Action
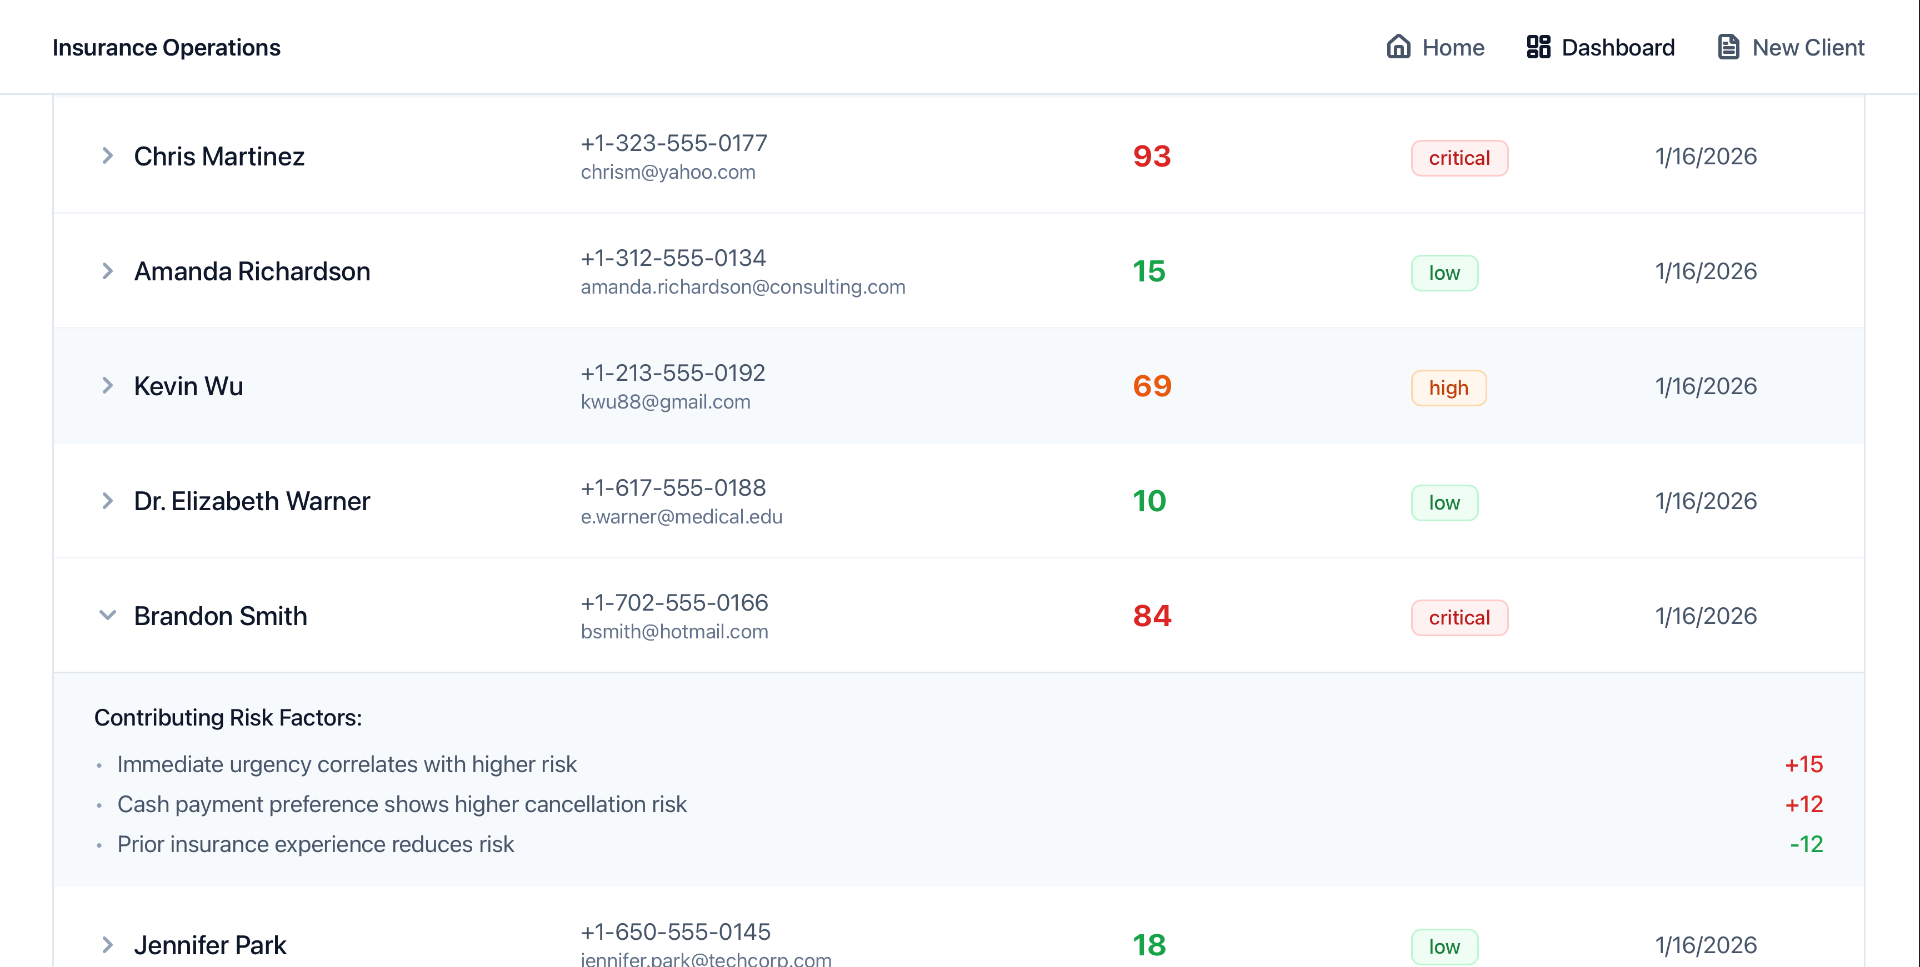
A live client list with risk scores ranging from 10 (Low) to 93 (Critical). Expanding Brandon Smith's row (score 84, Critical) reveals the factor breakdown: immediate urgency +15, cash payment preference +12, prior experience -12.