Flight Delay Risk Predictor
The Problem
Aviation data vendors, airlines, and companies in the aviation industry manage delay risk reactively. A flight gets delayed, the OCC (operations control center) scrambles to rebook passengers, reassign gates, and adjust crew schedules. The information that could have predicted the delay (departure time patterns, route complexity, load factors, weather signals) already exists inside the airline's own systems. Nobody is synthesizing it into a decision before the problem hits.
The cost of a single significant delay cascades: gate conflicts, crew duty-time violations, missed connections, compensation claims, and the hardest cost to measure, passenger trust. OCCs that could see risk two to three hours ahead would make fundamentally different decisions about crew buffers, gate assignments, and proactive rebooking.
Most airlines either have nothing in this layer, or they have a black-box prediction model that gives ops managers a number with no explanation. A risk score without factor attribution isn't actionable. You can't decide what to do about "85% delay risk" if you don't know what's driving it.
What We Built
A reference implementation of per-flight delay and cancellation risk scoring, with explainable factor breakdowns at the per-flight level and an ops-wide triage view.
For each flight, the system scores:
- •Delay probability as a calibrated percentage with Low / Medium / High classification
- •Cancellation probability, scored separately, because the drivers and base rates are different
- •Contributing factors with direction and magnitude. So instead of "this flight is risky," you see what's actually driving it: departure hour reducing risk by 6.9%, load factor raising it by 3.2%, weather severity contributing -0.7%
- •An FIDS (flight information display system) showing all upcoming flights on a single screen with delay and cancellation risk side by side, so duty managers can allocate attention to the flights that need it
Factor attribution is what makes this usable in practice. An ops manager who sees "high delay risk" can't act on that alone. An ops manager who sees "departure hour is the primary driver, load factor is compounding it, weather is neutral" can make a specific decision: extend the crew buffer, swap the gate, hold the connection. Risk score plus attribution turns a number into a decision.
Under the hood. Per-flight parameters feed in: flight number, scheduled departure hour, day of week, route type, load factor, weather severity index. A calibrated classifier (CalibratedClassifierCV wrapping LogisticRegression) produces probability outputs that work as actual probabilities, not just rankings. Calibration matters here. An ops manager acting on "70% delay risk" needs that number to actually mean 70%, not "high relative to other flights." Factor contributions come from perturbation analysis, a SHAP-style approach that measures how each input feature shifts the prediction.
The service layer is FastAPI with JWT-secured endpoints, stateless inference, and modular separation between the risk engine, service layer, and API surface. Endpoints cover per-flight scoring, factor explanation, cancellation risk, and the fleet-wide ops snapshot. Containerized and ready to deploy.
Outcome
A 2 to 3 hour forward-looking view on delay and cancellation risk for every upcoming flight, with actionable factor attribution. Duty managers stop reacting to delays after they happen and start making decisions before they hit. Crew buffers extended on the flights flagged as high-risk, gates reassigned proactively, connections held selectively rather than reactively. The class of decision changes from "scramble" to "triage."
The downstream effects compound. Fewer crew duty-time violations because buffers were added in advance. Fewer passenger compensation claims because rebooking happened before the missed connection. Fewer cascading delays through the daily schedule because high-risk flights got the attention they needed. Hard to quantify in the abstract, but operationally meaningful enough that several major carriers have already invested in internal versions of exactly this.
See It in Action
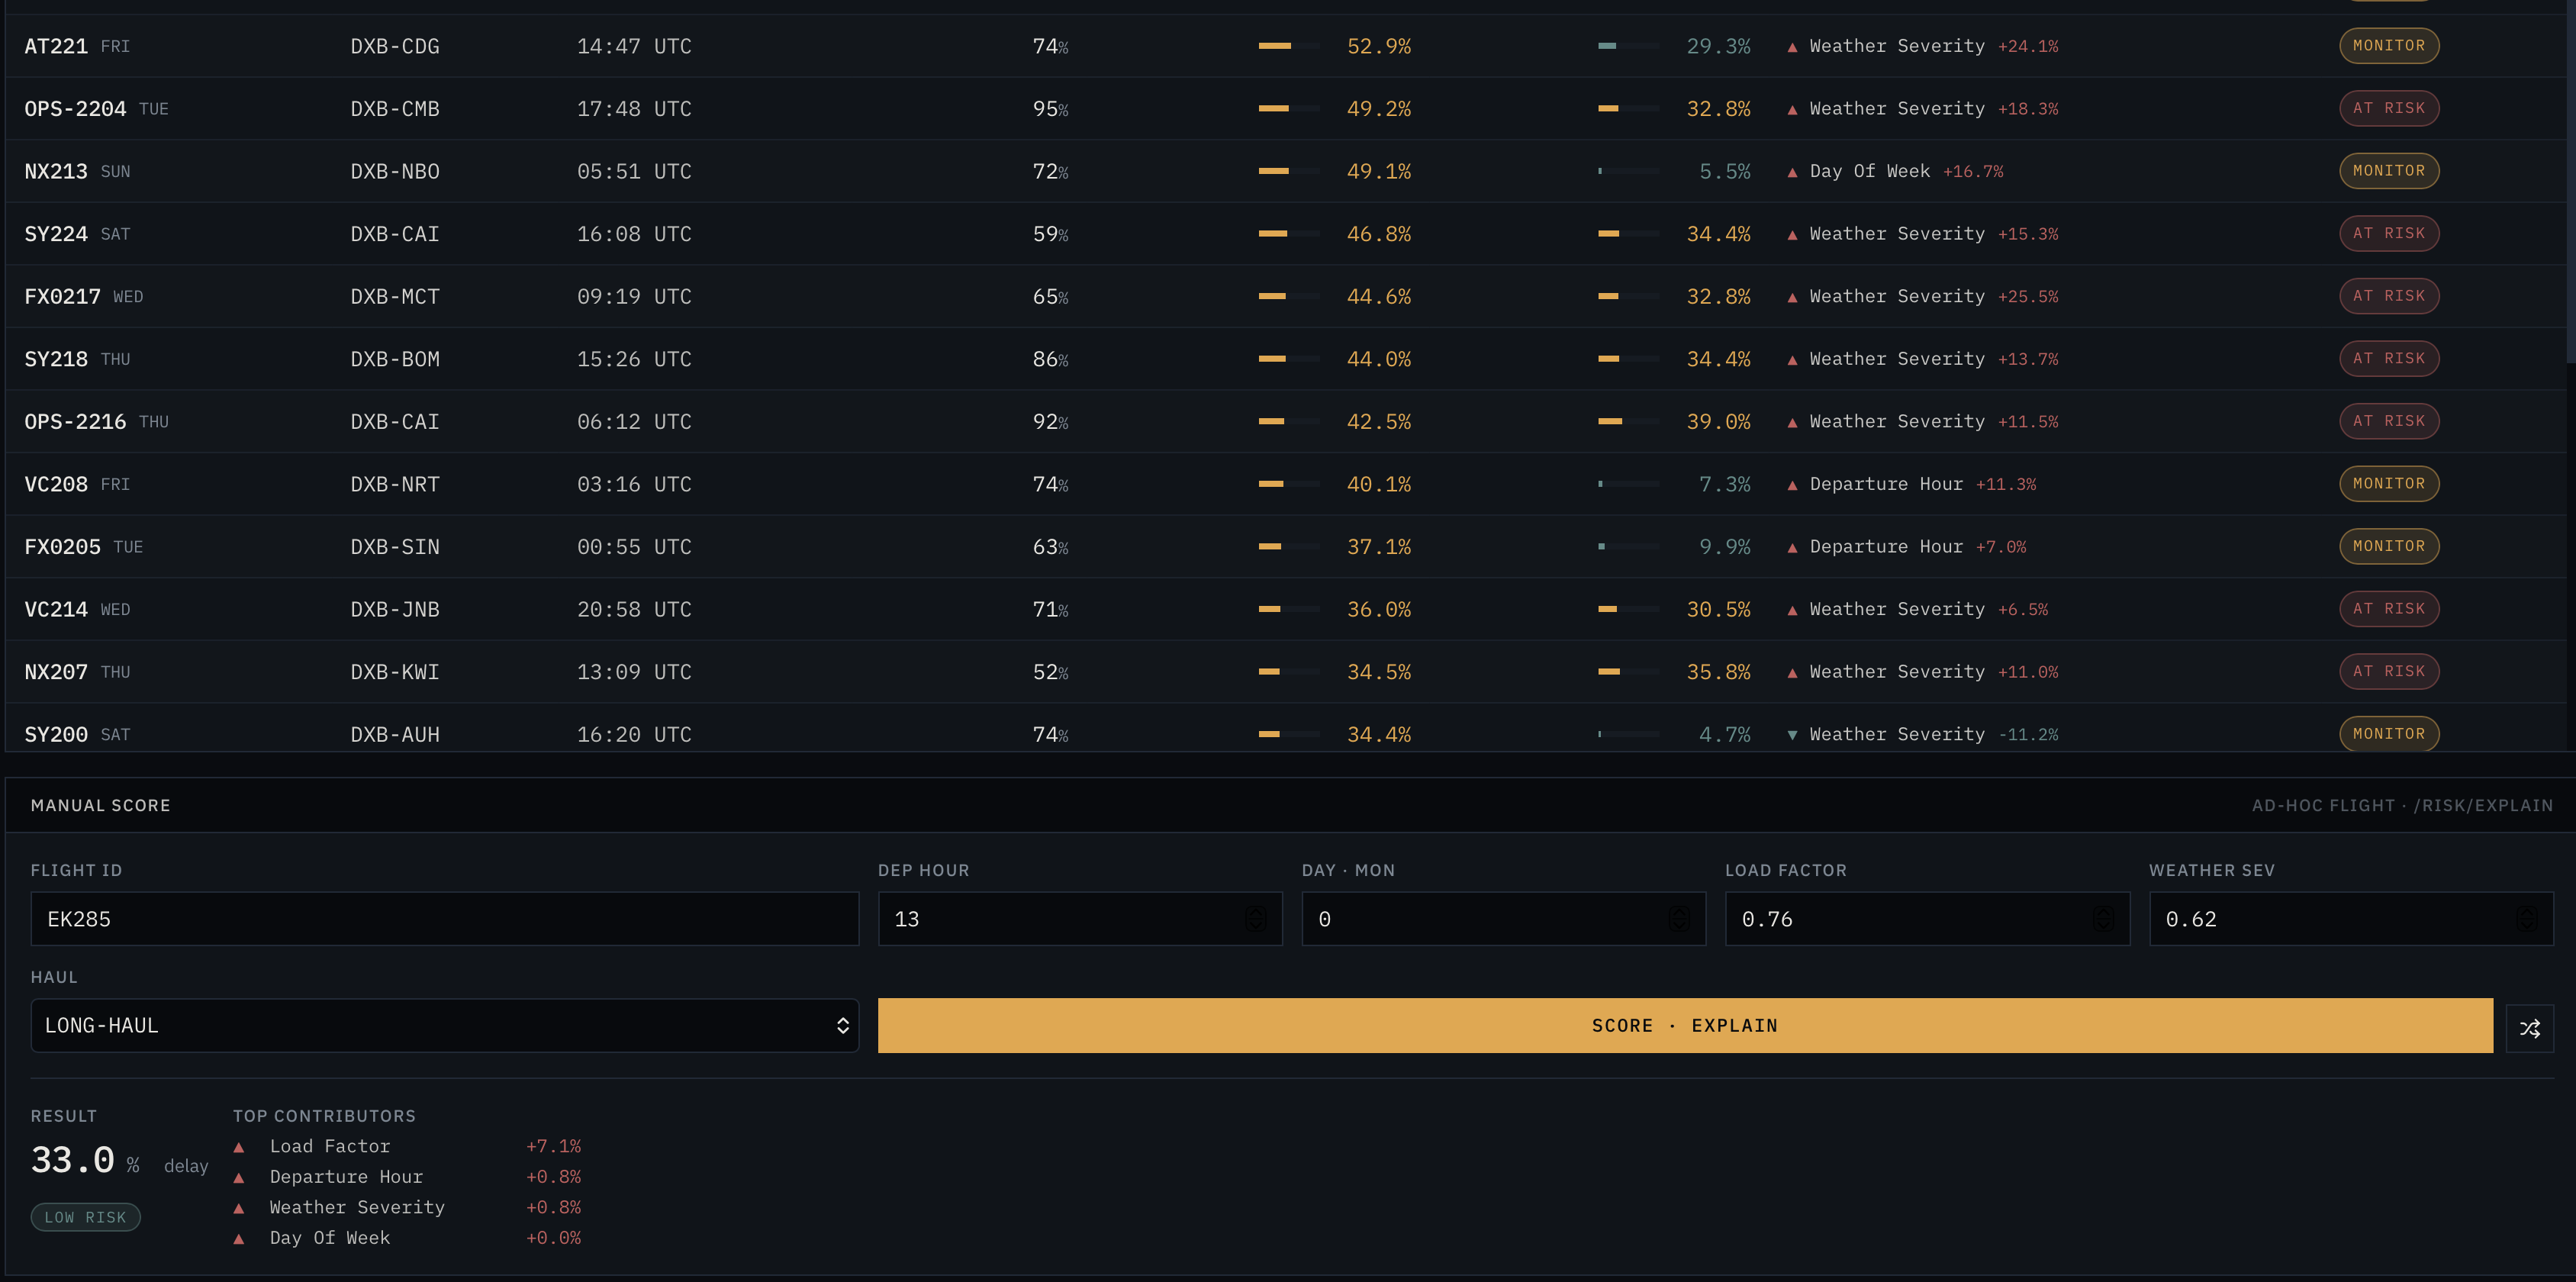
FIDS-style view with at-risk / monitor flags on every upcoming flight, plus an ad-hoc scoring panel returning a calibrated 33.0% delay risk for EK285 with factor attribution: load factor +7.1%, departure hour +0.8%, weather severity +0.8%.